Coof Clues
Sep 17, 2020

Archive of a Twitter thread (which I also reposted on Minds) about my deep dive into CDC death data, looking for patterns that might confirm or refute my suspicion that the Coof has been in America for years.

I didn't spell out Corona or COVID because Twitter was censoring independent discussion of it.
In the Minds repost I spelled out my conclusions at the bottom.

My charts are based on public data, with minimal processing to better discern patterns. You can download the data direct from CDC:
- 2014-18 final counts
- 2019-20 provisional counts

---------------------------------------------

thread: CDC data charts.

Exhibit A:

- all deaths 2014-20
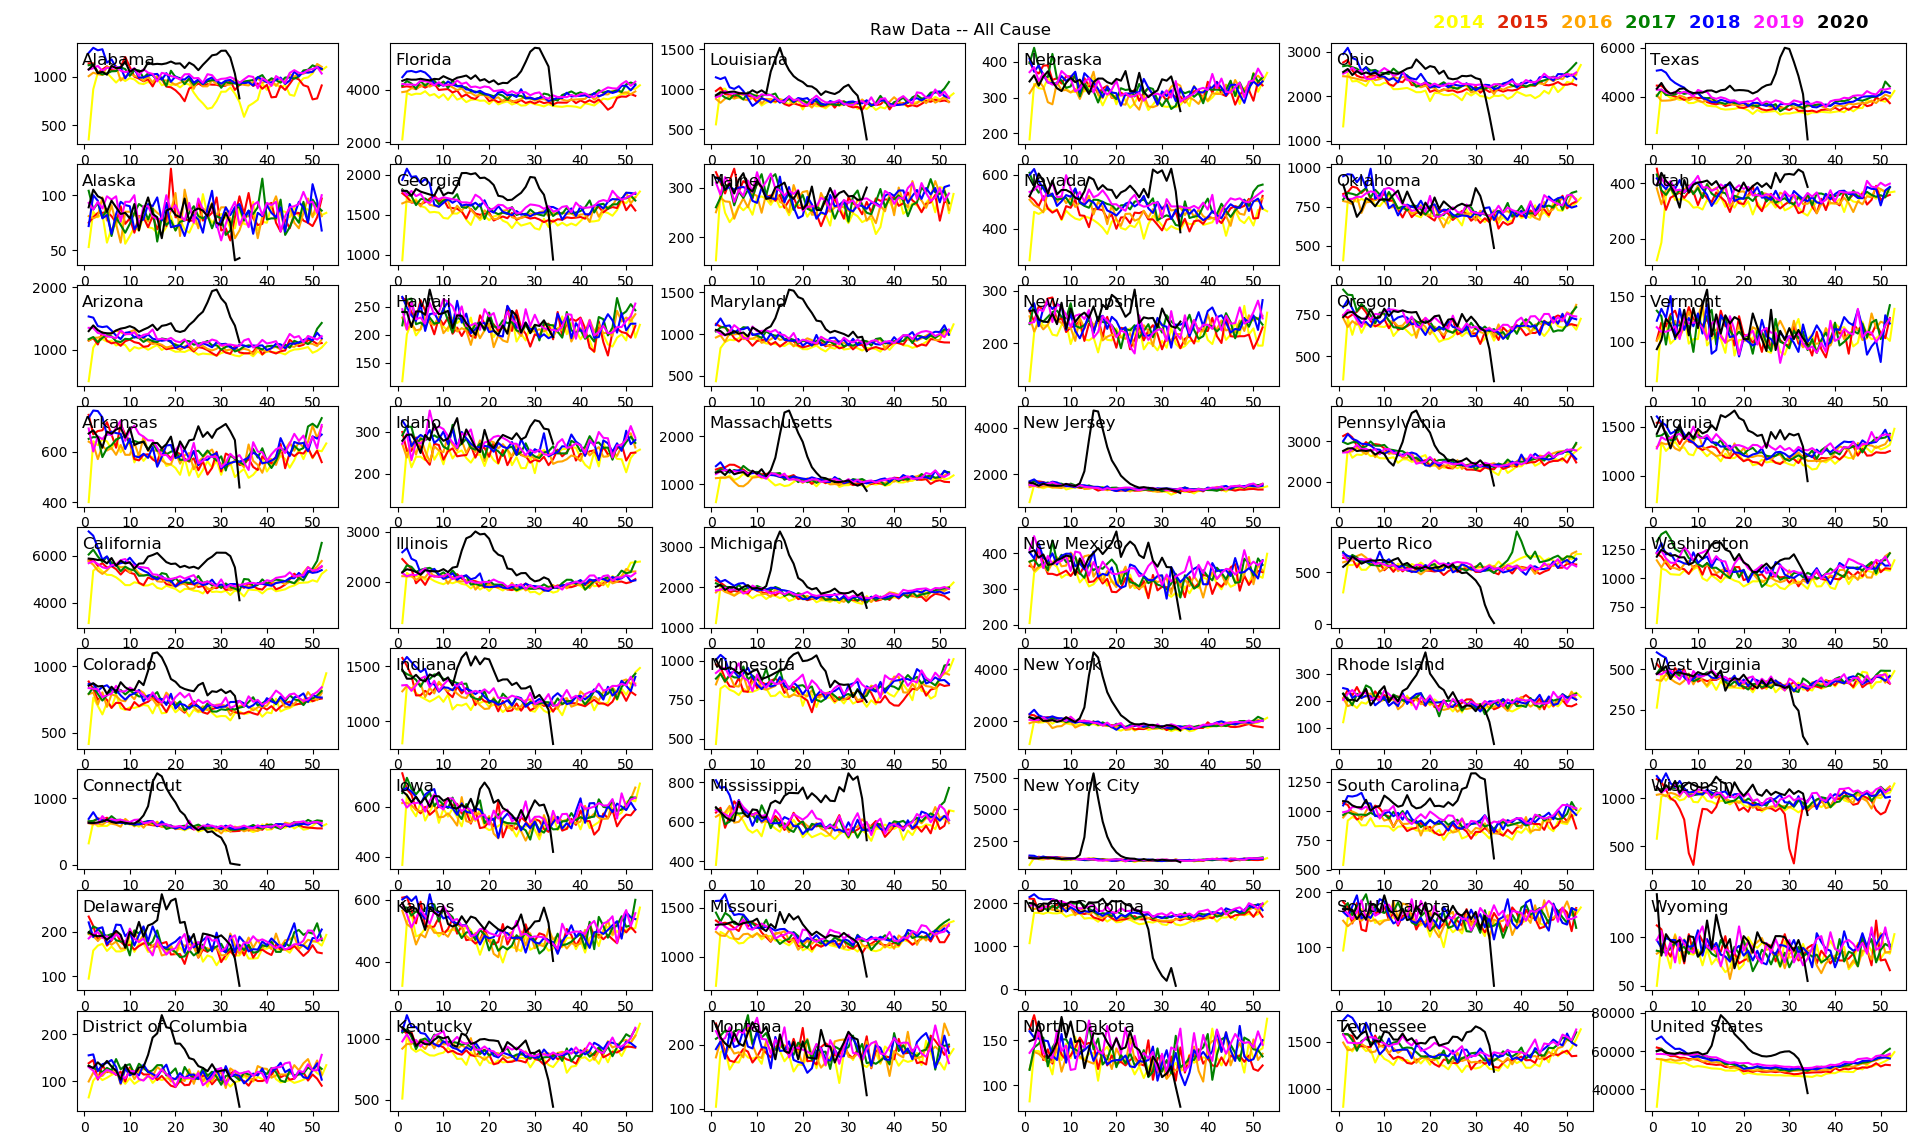
- running average (I'll use this from now on for clarity) [to smooth out the noise]

- 2015-19 only (so we can see more subtle trends)

apparently death reporting took a long holiday in jan.2014, so I'm excluding 2014 from most of my charts.

Exhibit B: abnormal/mystery deaths

beware - 2019-20 are provisional data, and this category is insignificant in smaller states

still, we can clearly see the 2020 trend starting in
dec'19 NYC+CT
jul'19 NC
mar'19 CA
dec'18 NY (upstate)

excluding 2020, we can see....
2018 is elevated in upstate NY, Ohio
2017-18 are elevated in Puerto Rico
2017 is high-normal in CA, AZ, AL, MI... significant?
june-oct 2016 epidemic in AZ

june-oct 2016 epidemic shows up nationally in this percentage-of-total-deaths chart.

WHAT WAS THAT??

Exhibit C: any trends in other diseases?

- Cancer-chan and Septicemia took a holiday in 2018-19
- Diabetes and Stroke filled in for them

Hypertension is a major risk factor for Stroke

what are the main risk factors for our new friend?  [Corona-chan]

Diabetes and Hypertension! 🤔

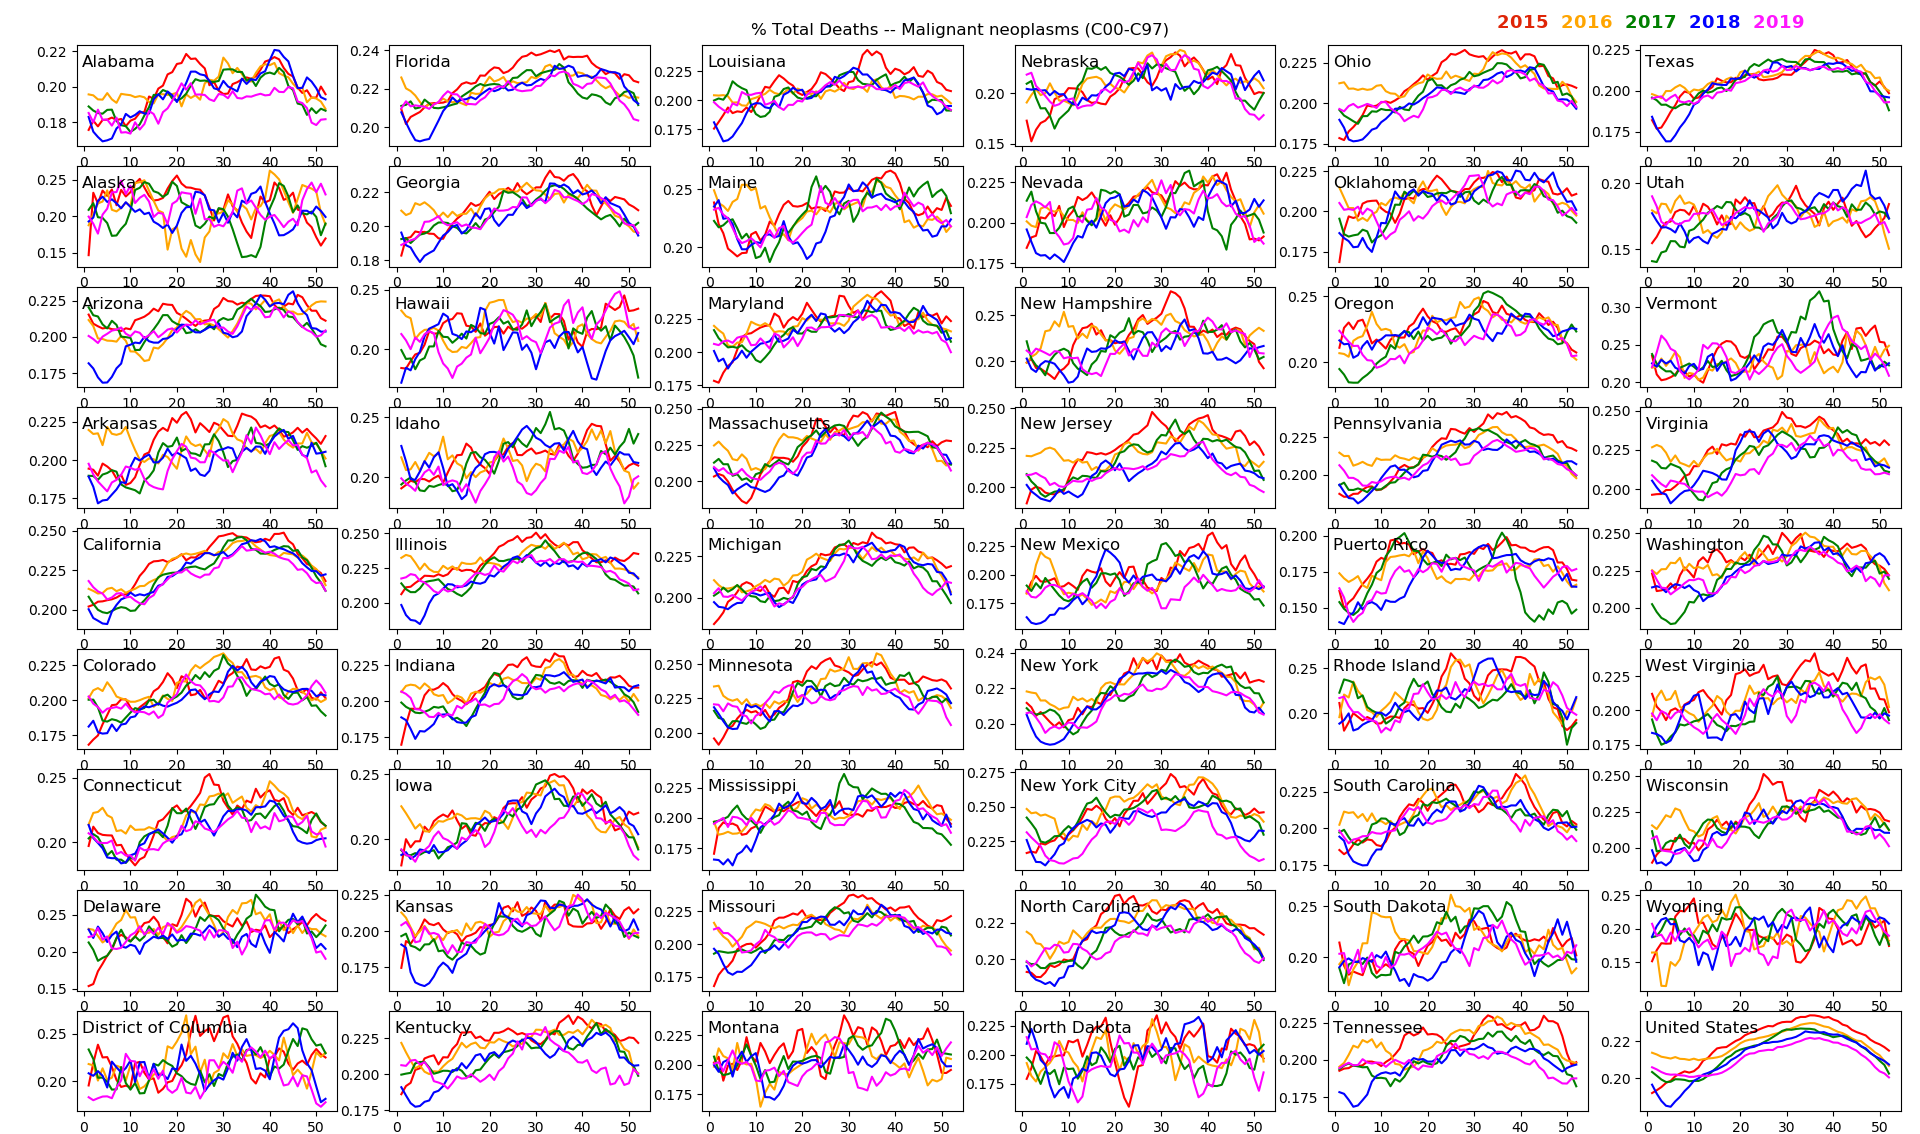
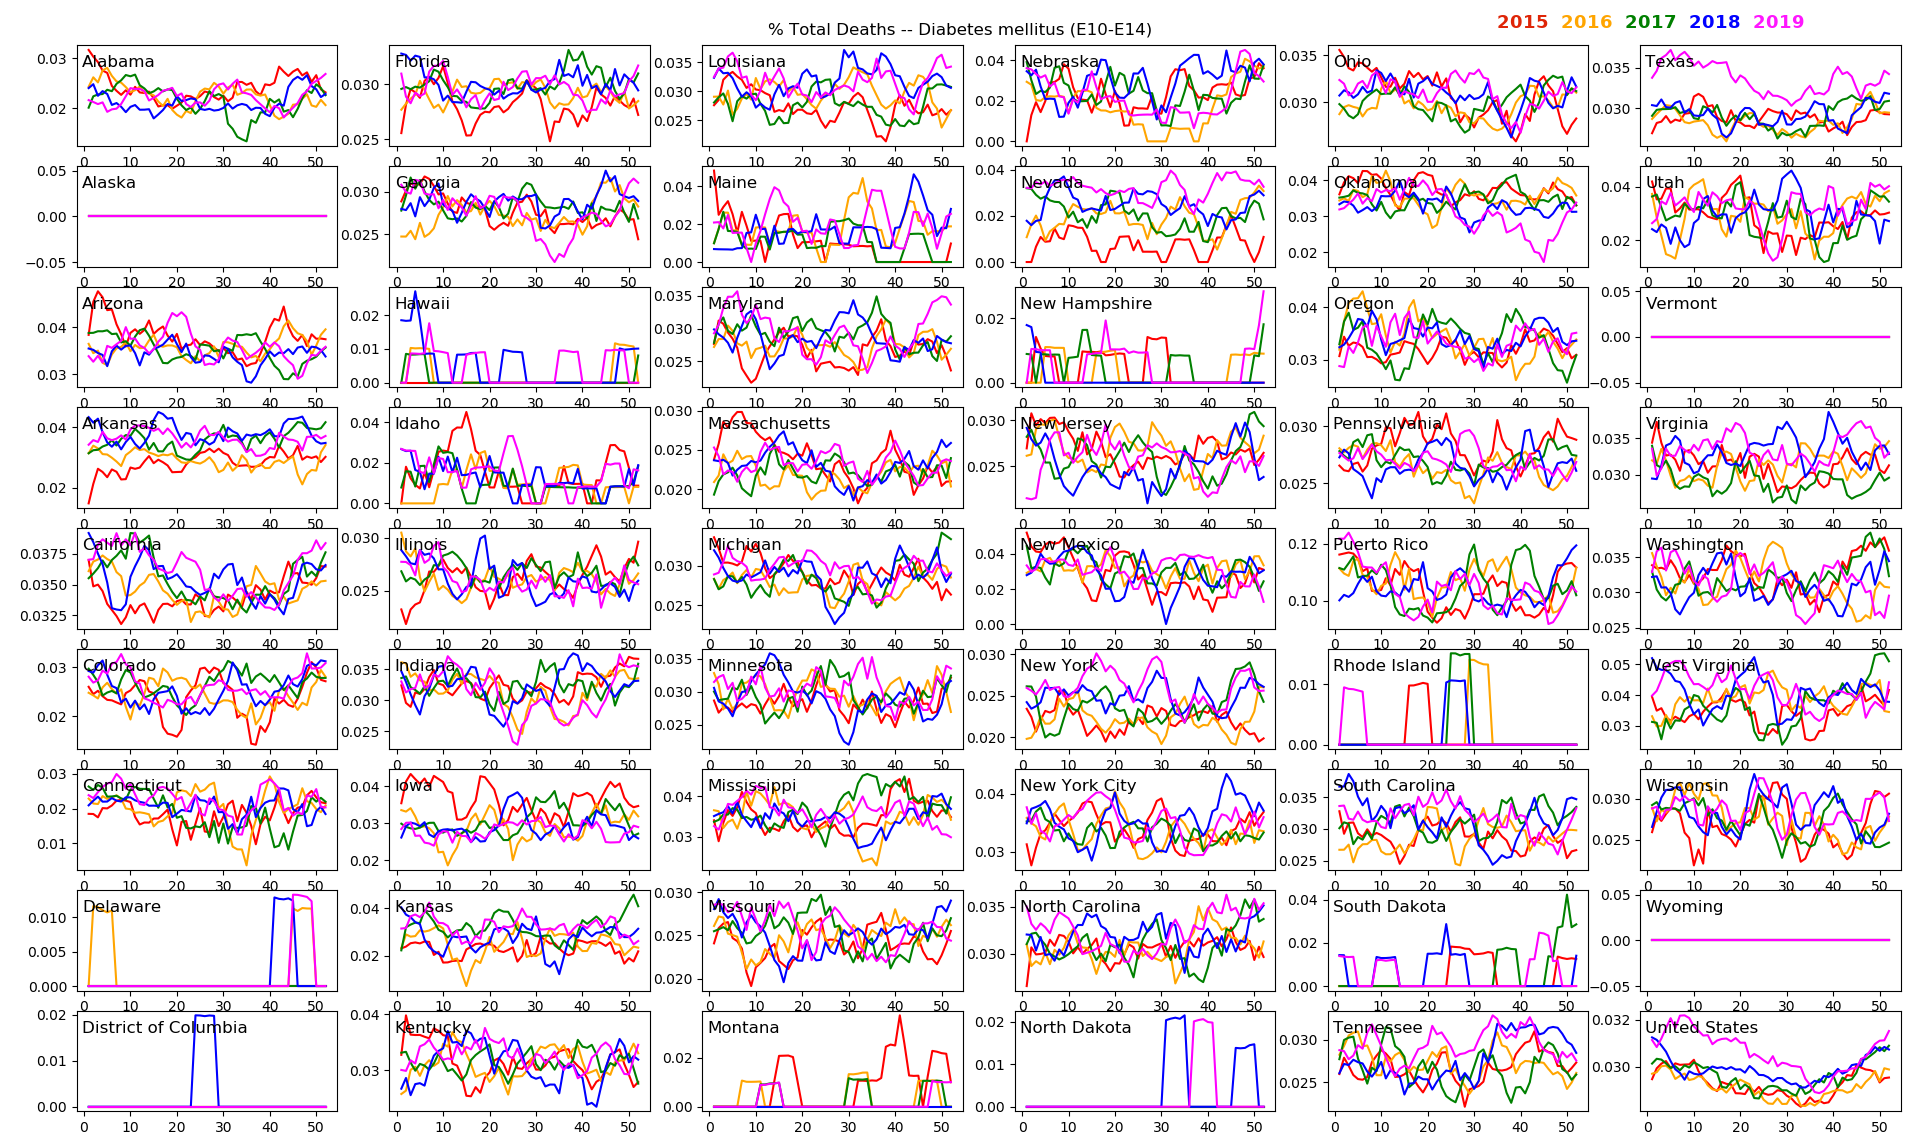

Exhibit D: other diseases in the first half of 2020 (excluding incomplete jul-aug data)

Cancer drops off around NYC and Washington state in wave 1

Stroke, Diabetes, Pneumonia+Influenza all spike

~5,000 "diabetes" deaths!

surpise: no P+I spike before mar.2020!


one more oddity: Deaths by natural causes suddenly dropped a whole 1% across the board from 2014-15 to 2016-19.

what??

new diagnostic criteria under Trump admin?

despair+violence in the Trump era?

accidents+OD's?  [YES - there was a huge rise in unnatural deaths by drug overdose]

data manipulation?

reality check

total deaths are up +200k over the first 8 months of 2018 and 2019

seems like a legit upper bound ('counting liberally') for deaths caused/hastened by our new friend

but it's possible this first hit in 2016 or 2017

in AZ, CA, TX, PR

migration hot spots...?


and NY doesn't look right at all

it looks like she was there by 2017, causing obvious changes in disease patterns

and it looks like criteria were changed early this year to fit a changing narrative

------ /end twitter thread
Unscientific Conclusions
When is COVID-"19" first detectable in CDC death counts?

- In raw data, which is noisy: March 2020 in several states and nationwide.

- In abnormal death counts (5-week avg): December 2018 in upstate NY, March 2019 in California, July in North Carolina.

- Abnormal deaths as a percentage of total deaths: all the way back to early 2018 in NY and Ohio (Buffalo epicenter?). 2018 data is final, so this counters the "muh provisional data" debunking.

- Possibly (this may just be some other minor epidemic) summer 2016 in Puerto Rico, Arizona, and maybe California, Alabama, and Michigan. This is a stretch.

- Odd patterns since 2016 in some states for diabetes, stroke, heart disease, and alzheimers. Could be COVID. Could simply be changes in diagnostic criteria, CDC guidance to state health depts, or political interference from anti-Trump people or from Trump himself.

- Fits the timeline for the 2015 lab accident theory, the 2012 Mojiang mine disease theory, earlier natural origin theories, etc.


Could this explain why "wave 1" ended early in some areas, especially the northeast? Sure, if there were widespread mild/asymptomatic infections that didn't lead to many deaths.

Is it possible that COVID deaths have been misclassified as other disease, or vice-versa? Yes, for certain, both ways. It may be a wash.

Is COVID reducing other causes of death by hastening imminent old-age deaths? Somewhat... we'll know for sure if overall deaths drop by ~100k per quarter in 2021 compared to 2020.
[Nope, that didn't happen because COVID didn't kill all the boomers and it didn't go away.]

If it's been around for 3+ years, why did deaths spike in 2020? Maybe because COVID patients were sent to nursing homes, whether unwittingly or in an act of biological warfare/terrorism... for which H3N2 influenza could've served just as well because the 2019 vaccines didn't cover the new strain.

Have I had COVID? Yes, I'm 90% sure I caught it in upstate NY in May 2019, that why I take it sort of seriously. Whatever I had, it was everything they say COVID is. I thought maybe it was SARS. Seriously considered going to the hospital. Took me a couple months to get back to 100%. It sucked.
Comment
2020 cause of death data is garbage. All we really know is the total (if we trust the CDC even that much)

Could they salvage it? Maybe...
1. release /individual/ cause of death records, anonymized ofc, for verification.
2. instead of counting the 'primary' cause of death, divide it among all comorbidities...

>say a diabetic cancer patient dies of a stroke with symptomatic covid.
it's not "1 covid death"
it's .25 diabetes, .25 cancer, .25 stroke, and .25 covid.

if it's asymptomatic covid, it doesn't count. just a "covid positive" flag.

unnatural causes cancel out natural causes

>died in a motorcycle crash with covid and hypertension?
1 accidental death, just flag the other conditions.

>died under police restraint while OD'ing on fentanyl and covid+?
.5 restraint trauma, .5 drug overdose, 0 covid


it would look something like this for NY state.

covid's share would come out to 9k instead of 25k.

about 36%.. so nationally, 197k is really 71k?

yes, covid contributed to all their deaths
but 1/3 died of old age triggered by covid
and 1/3 died of bad diet/fitness, ditto

Here's the source link. https://covid19tracker.health.ny.gov/views/NYS-COVID19-Tracker/NYSDOHCOVID-19Tracker-Fatalities?%3Aembed=yes&%3Atoolbar=no&%3Atabs=n

COVID deaths: "Fatalities by Age Group"
Other causes: "Top 10 Comorbidities"

In each age group:
Total up all comorbidities (including COVID!!)
Divide each comorbidity by total
Multiply by total deaths
Plot a stacked bar chart